Good Measures
GMSF Digital Methodology
Estimating GHG Emissions from the Digital Advertising Industry.
Over the past two years, Good-Loop, in collaboration with Ad Net Zero, IAB Europe and other media experts have developed the Global Media Sustainability Framework (GMSF), a robust framework for estimating the greenhouse gas (GHG) emissions across all media channels. The GMSF is a voluntary, omni-channel solution, which forms the foundation from which all industry estimation standards should be based. In essence, it is the blueprint for conducting life cycle assessment (LCA) from media campaigns. An LCA is a systematic analysis of the environmental impact over the course of the entire lifecycle of a product material, process or other measurable activity.
The GMSF was created to standardise and improve the precision of GHG estimation models across all advertising channels, addressing the issue of variability of absolute GHG estimates across calculators and solution providers. Now, industry bodies with the help of climate scientists and media experts have defined the scope, and structure of the GMSF and have provided the formulae and data sources to enable representative and consistent GHG emissions estimates.
At Good-Loop, our GHG estimation model is now fully integrated with the GMSF Digital Framework guidance for estimating the GHG emissions from the processes involved in the Creation, Distribution and Consumption of a digital ad. All equations and data points used in our calculations are available in the source framework and will be further outlined below.
The Lifecycle of a Digital Ad.
In the GMSF, there are 3 main lifecycle phases across all advertising channels; Creation, Distribution and Consumption. However, the underlying processes may differ from channel to channel.
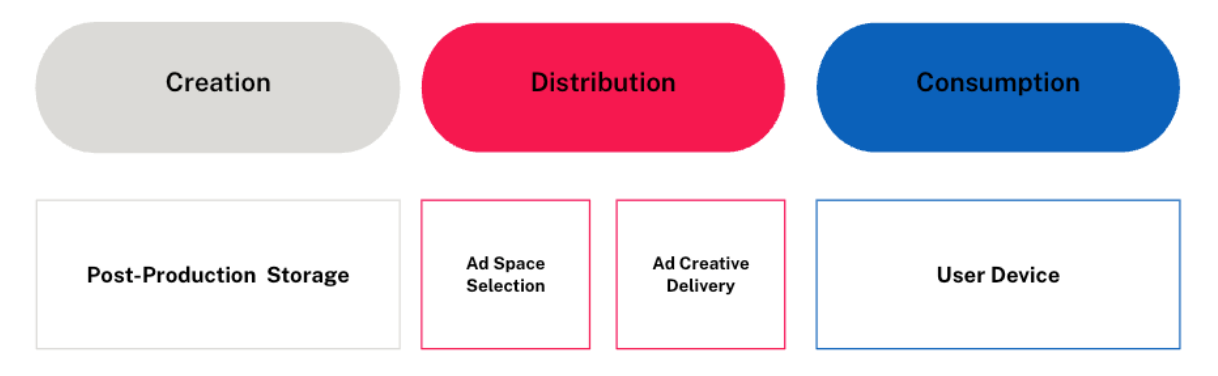
Creation
Creation phases emissions are attributed to the energy requirements for Post-production Storage of creative assets across different storage mediums.
Distribution
Distribution phase emissions are attributed to the energy involved in:
1. Ad Space Selection: Selecting and bidding for ad spaces via Real-Time Bidding (RTB) or Direct Buys.
2. Ad Creative Delivery: Transmitting ad content through networks to the user’s device.
Ad Space Selection
This covers the process of RTB auctions and direct sales accounting for the energy attributed to DSPs, SSPs and intermediaries. The emission calculations include:
- Datacentre Server Use-Phase Emissions: Emissions from server energy use in bidding and ad processing.
- Datacentre Server Embodied Emissions: Emissions from transport, manufacturing and disposing of bidding servers.
- Network Use-Phase Emissions: Emissions from network energy use when bidding calls.
- Network Embodied Emissions: Emissions from the transport, manufacturing and disposal of network infrastructure.
Ad Creative Delivery
This covers the transmission of the ad creative to the user’s device. The emission calculations here include:
- Server, Edge Node and Network Use-Phase Emissions: Energy allocated to servers and edge nodes and the network infrastructure to deliver an ad creative to the audience.
- Server, Edge Node and Network Embodied Emissions: Emissions from the production and disposal of servers, edge nodes and network infrastructure.
Consumption
Consumption phase emissions are attributed to the energy from individuals viewing the ad on their digital device. This includes:
1. Device Use-Phase Emissions: Energy used by the user’s device during ad viewing.
2. Device Embodied Emissions: Emissions from manufacture, transport, and disposal of user devices.
Each calculation factors in the type of device, its energy use, and carbon intensity based on its location.
GMSF Terminology and Definitions.
CO2e
CO2e is a unit for estimating carbon footprints. It expresses the impact of GHG emissions in terms of the amount of CO2 that would have the same global warming effect. This allows for the comparison and aggregation of emissions from various greenhouse gases.
CO2ePM
CO2e PM refers to the normalised impact, in terms of CO2e, per thousand impressions from an ad campaign. It can be seen as a metric for how “carbon efficient” a campaign is.
Use-phase Emissions
Use-phase emissions are the GHG emissions from the energy consumed by digital infrastructure such as servers, networks and user devices when they are utilised for advertising purposes. One example would be the GHG emissions from the energy used by a server when transmitting an ad creative to a user device, which would fall under creative distribution emissions. Another example,would be the GHG emitted in producing the electricity used by a PC when consuming ad content. This would fall under the consumption emissions category.
Embodied Emissions
Embodied GHG emissions, in the context of the GMSF framework, are the emissions from the manufacturing, transport and end-of-life disposal of digital devices and infrastructure. For example, the emissions from the manufacture of a server, the transport of the server to the business or user and the emissions used from the disposal of the server once it has reached the end of its useful life.
‘Data Hacks’
In simple terms ‘data hacks’ refers to additional data guidance which can be used if certain data points are unavailable to a user who wishes to estimate the emissions from their media activities. In essence, reasonable estimates or intuitive guidance may be used in place of media product level data. An example of this is when creative weight is ‘unknown’ but the creative type is ‘video’, a conservative value of 4MB would be used in place of the unknown value. As well as replacing actual data points, ‘data hacks’ may affect the equations used to calculate emissions. This will be explored in the sections below.
Formulae and Data Guidance
This section focuses on the digital channel and the processes where both equations and data guidance have been fully developed. Each equation utilises a combination of different kinds of data points. These are:
Inputs: Data points provided by a GMSF user, such as impression number, deemed to be essential for emissions estimations.
Defaults: Intermediary or standard values required to operationalise formulae. These come from contributed data or known industry standards.
Constants: These are values, such as LCA-based emissions factors, used to convert units of activity to GHG emissions.
Creation Formulae
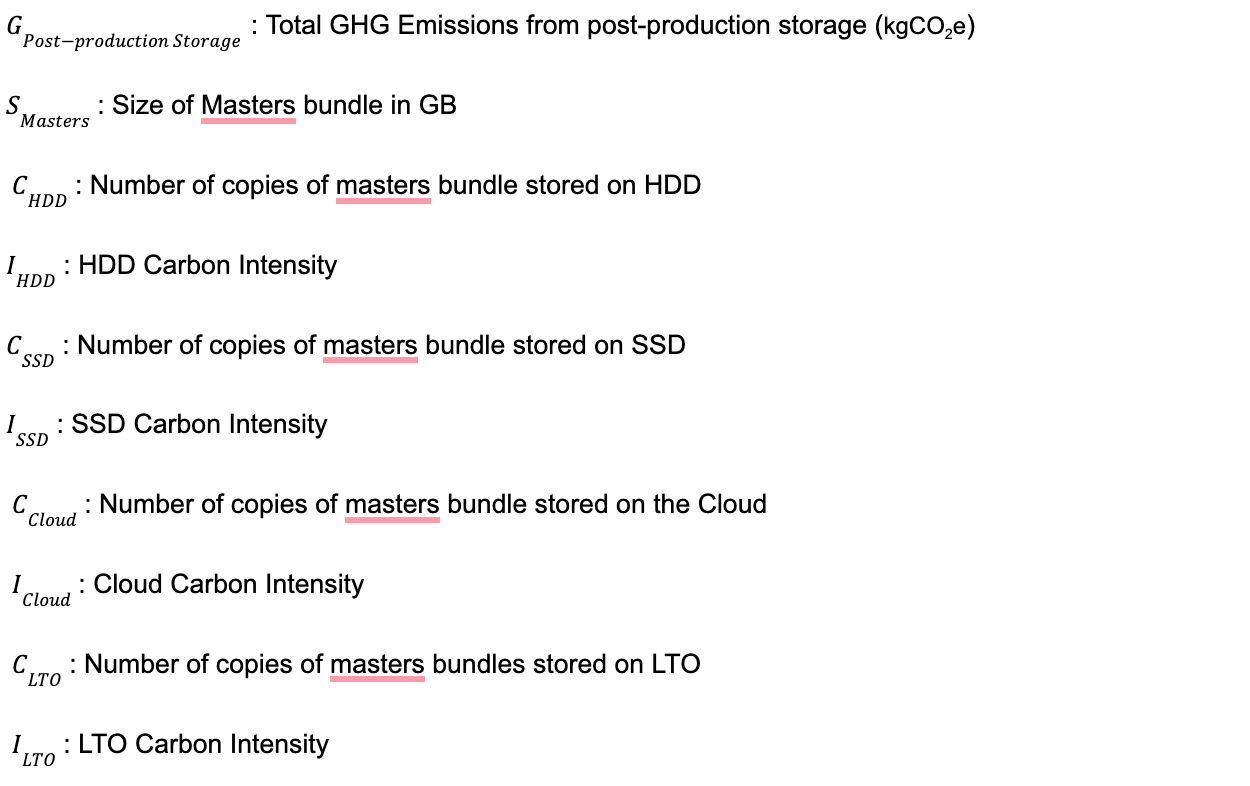
In version 1.2 of the GMSF, equations for the process of Post-production Storage have been defined. This accounts for the emission attributed to the storage of masters bundles containing all creative assets for campaign. Typically this information is held by a creative agency and as such an RFI (available in the GMSF) may be sent to an agency to obtain these data points.
Formula 1: Post-production Storage Emissions

Definitions:
Distribution Formulae
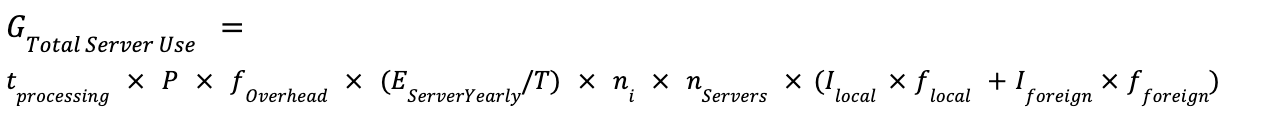
Formula 2: Ad Space Selection - Data Centre Server Use-Phase Emissions
Step 1: Calculate Data Centre Server Energy Use per Ad Opportunity

Step 2: Calculate Data Centre Server Usage Emissions

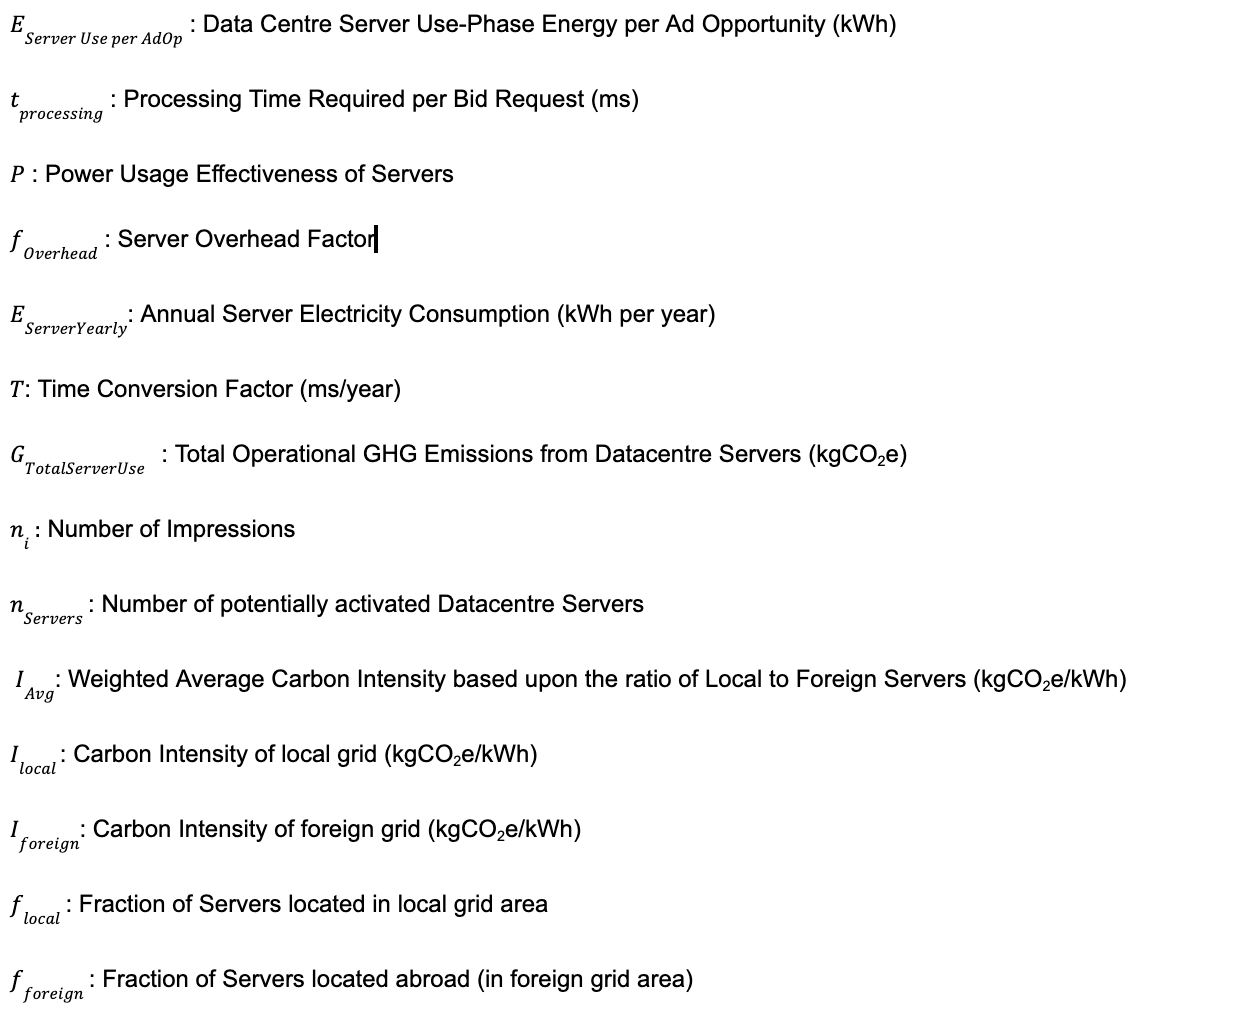
Complete Formula:
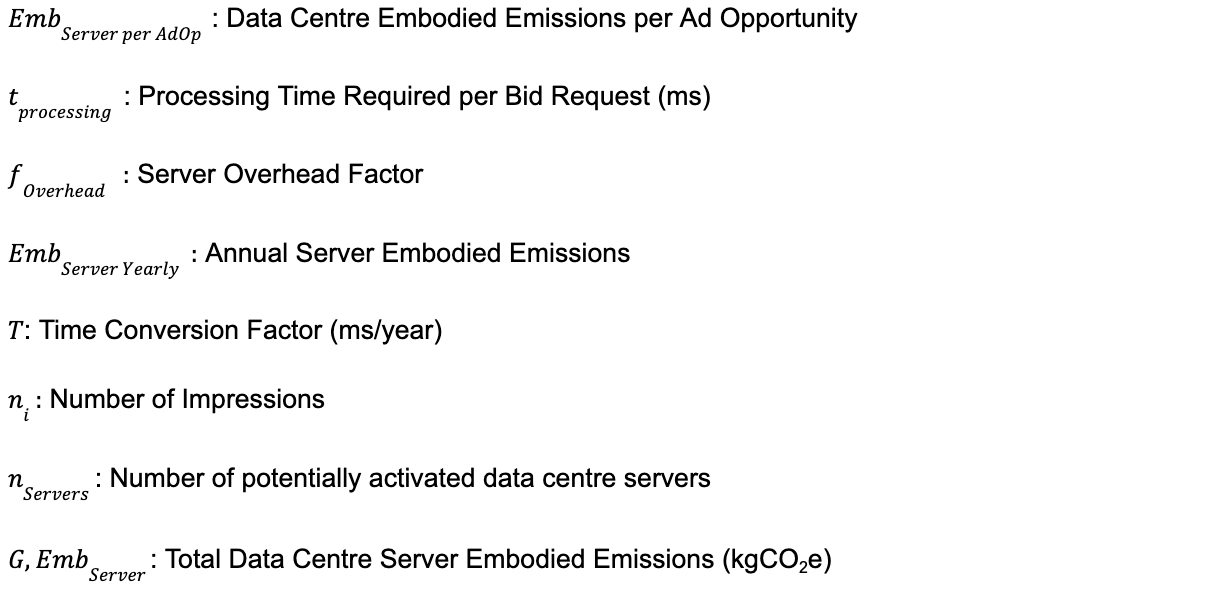
Definitions:
Formula 3: Ad Space Selection - Data Centre Server Embodied Emissions
Step 1: Calculate Data Centre Server Embodied Emissions per Ad Op

Step 2: Calculate Total Data Centre Server Embodied Emissions

Complete Formula:

Definitions:
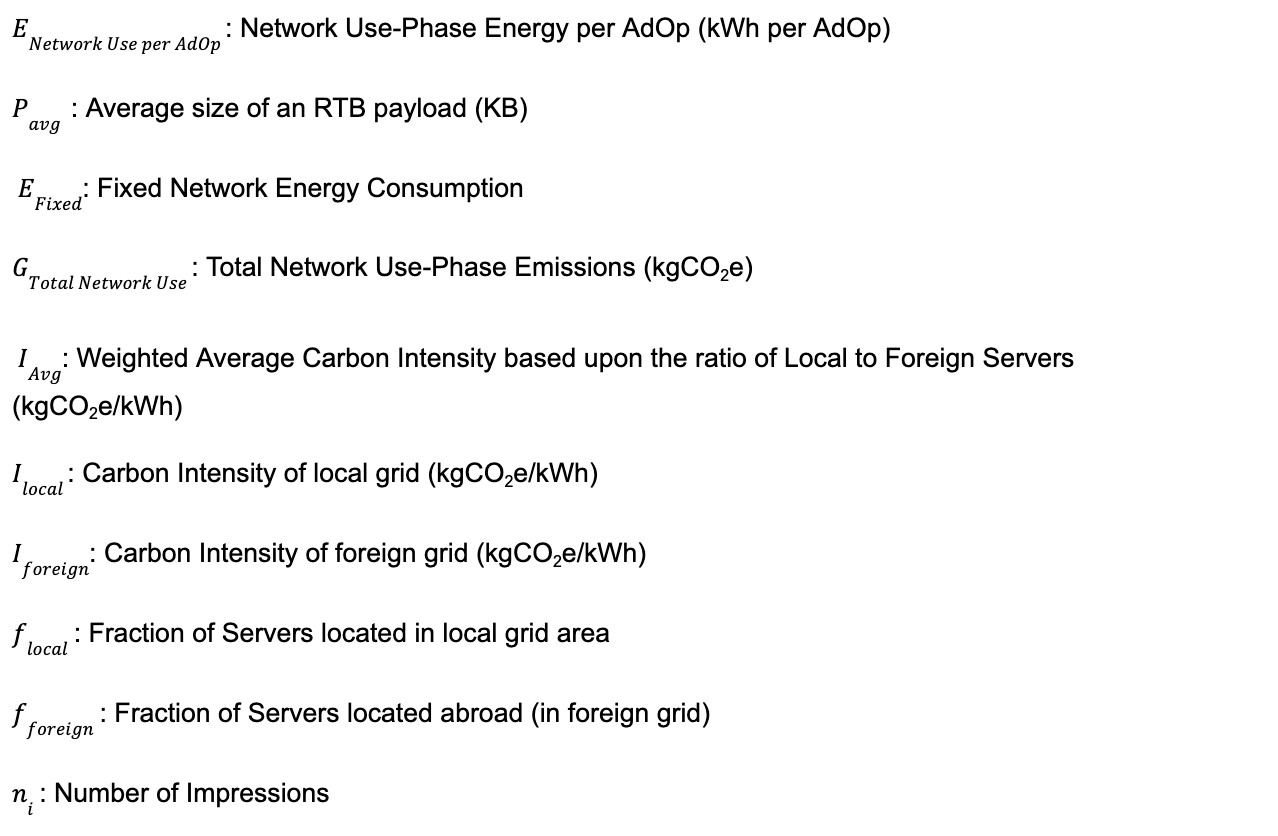
Formula 4: Ad Space Selection - Network Use-Phase Emissions
Step 1: Calculate Network Energy per Ad Opportunity

Step 2: Calculate Total Network Energy Use

Where:

Complete Formula:

Definitions:
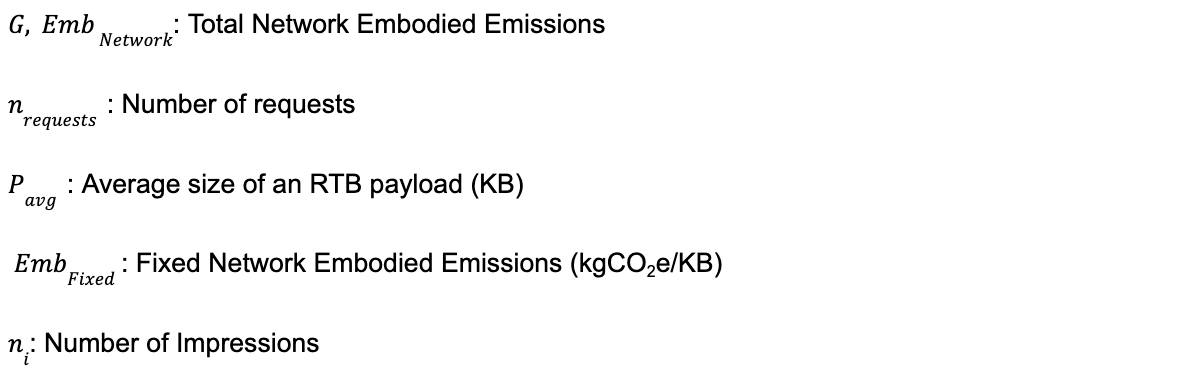
Formula 5: Ad Selection - Network Embodied Emissions

Definitions:
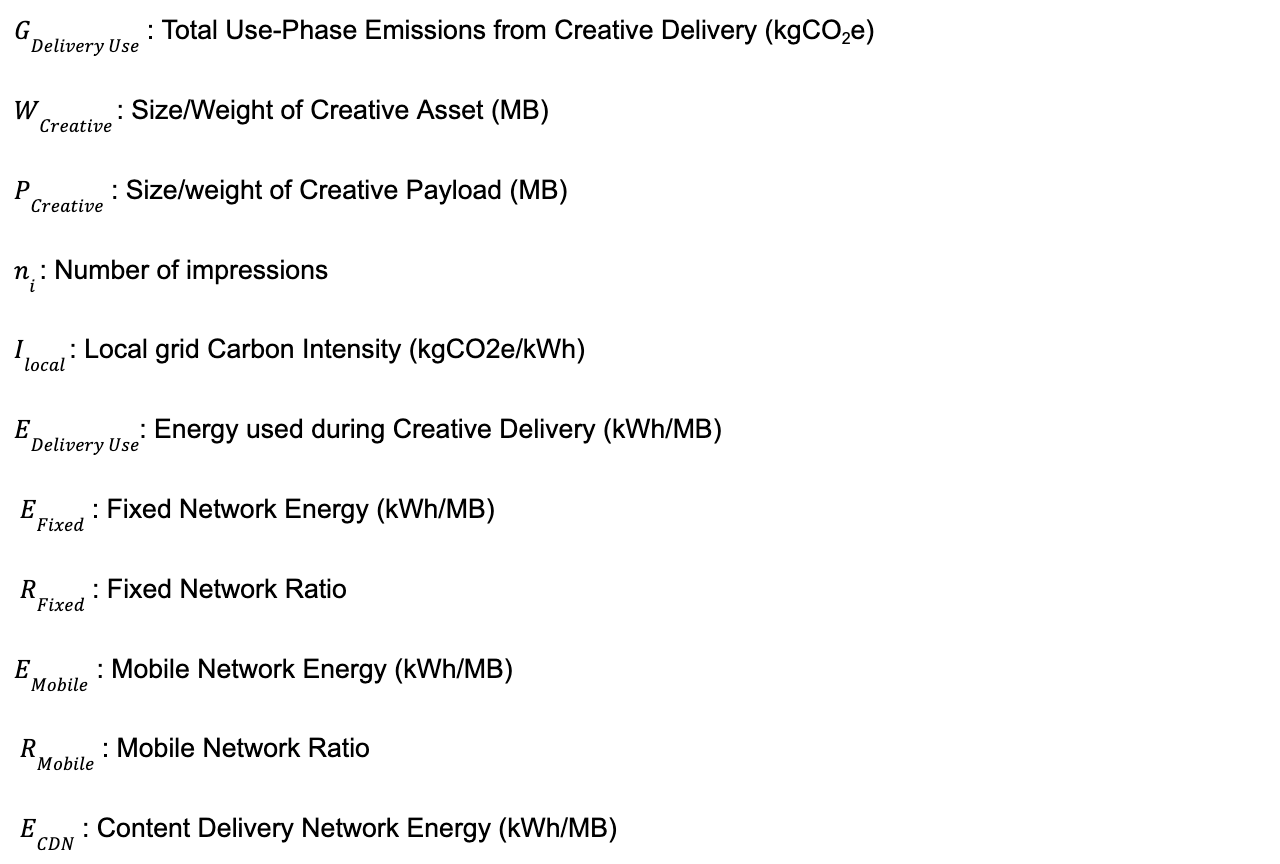
Formula 6: Ad Creative Delivery - Creative Transmission Use-Phase Emissions

Where:

Definitions:
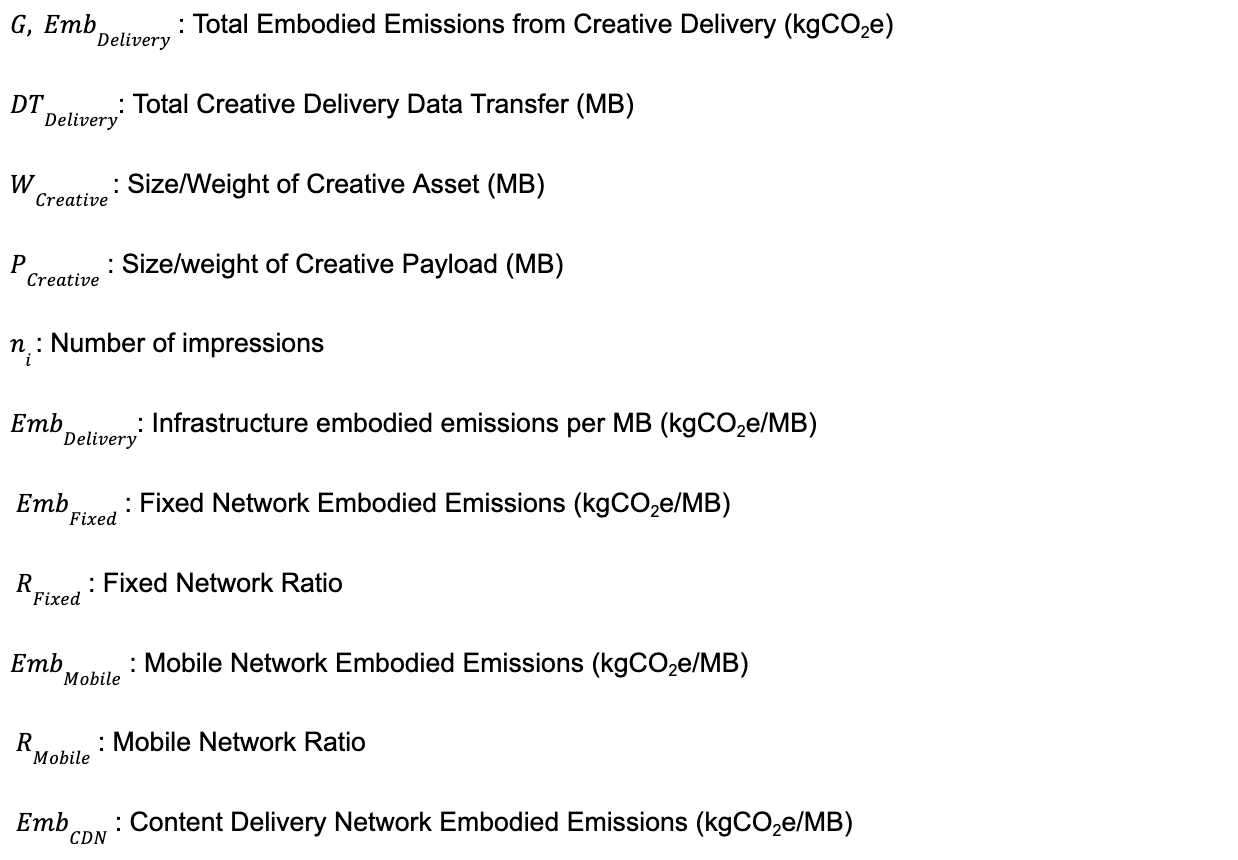
Formula 7: Ad Creative Delivery - Creative Transmission Embodied Emissions

Where:

And:

Definitions:
Consumption Formulae
For each device type, the following calculations are applied:
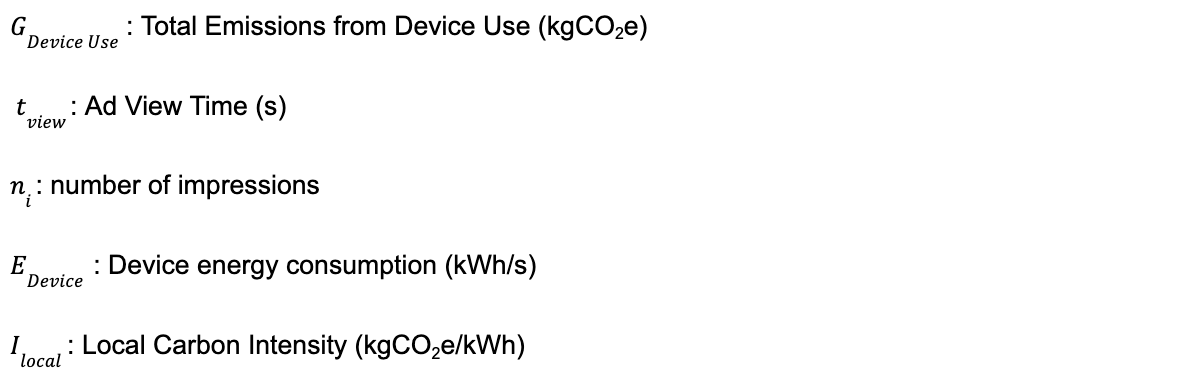
Formula 8: Consumption - Device Use-Phase Emissions

Definitions:
Formula 9: Consumption - Device Embodied Emissions

Definitions:

GMSF Data Guidance - Step-by-Step
In the GMSF documentation, ‘data hacks’ are guidance which may be followed when certain data points are unavailable. However, in some cases, it is unclear how this guidance may influence the resulting formulae, specific data point or variable. Below, a step-by-step guide is provided with instructions on what to do in the absence of specific data points.
Creation Phase Guidance
No data guidance is currently available. Data for the post-production storage data may be obtained by sending an RFI to the creative agency.
Ad Space Selection Guidance
For the process of Ad Space Selection there are currently recommendations for level 0 and level 1 processes when certain data points are unavailable. Specifically, there are recommendations to calculate the number of servers and the number of calls (requests and responses) sent between servers, during the process of RTB using ads.txt data.
Level 0
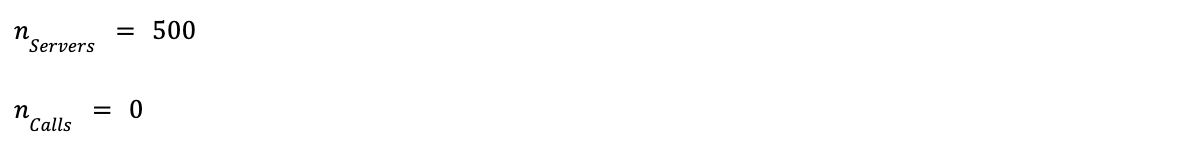
In the absence of domain level data or an ads.txt file:

Level 1
For the level 1 process, when domain data and ads.txt line number is available, the resulting formulae are as follows:
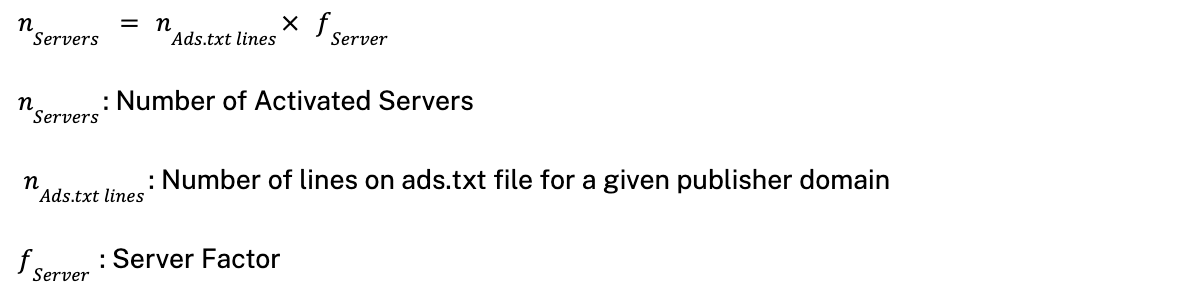
Formula 10: RTB - Calculate the number of activated servers:
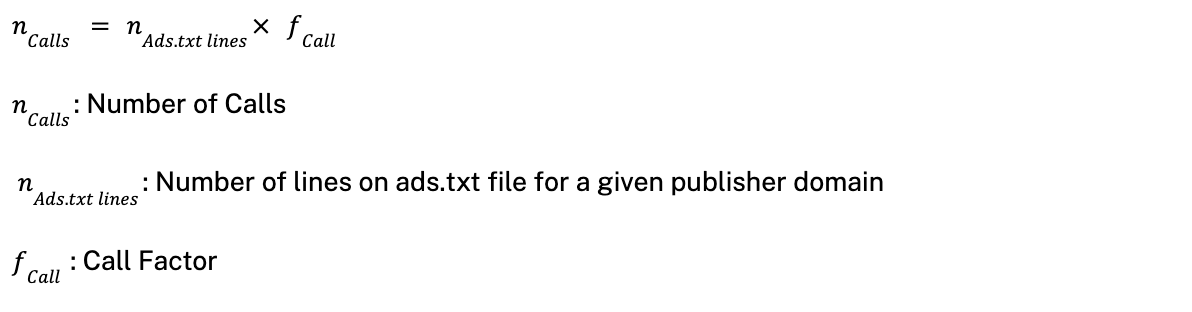
Formula 11: RTB - Calculate the number of calls:
End-to-End Platform Guidance
For end-to-end platforms, such as social media sites, the following default values may be used:
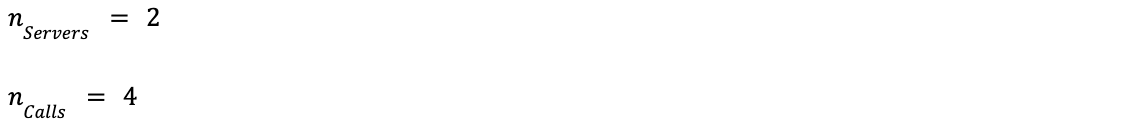
Direct Sale Guidance
In the case where inventory is bought via direct deals which do not undergo programmatic auctioning:
Ad Creative Delivery Data Guidance
Creative Data Transfer
For the process of Ad Creative Delivery there are recommendations for level 0, 1, and 2 processes to follow when certain data points are unavailable. Specifically, there are recommendations to estimate the data transferred by sending creative assets from ad servers to end user devices.
Level 0 and 1
When creative type is ‘Display’ and ‘Creative Weight’ is unknown:

When creative type is ‘Video’ and ‘Creative Weight’ is unknown:

When creative type is ‘Instream Video’ and ‘Creative Weight’ is unknown:

Level 2
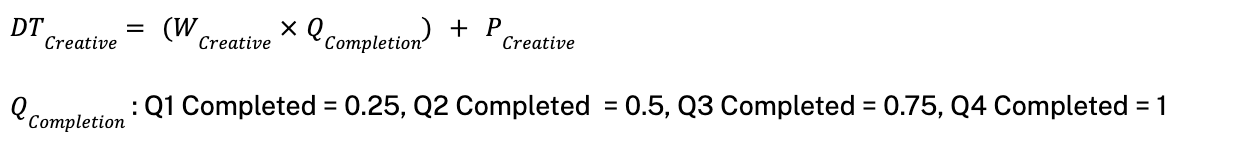
For video ads, when completion quartiles are known:
Network Ratios
When the type of delivery network used to deliver ad content is unknown, a ratio can be applied based upon contributed traffic data in different geographical regions. In cases where the connection type is known the following ratios are applied:
When the delivery network is mobile:
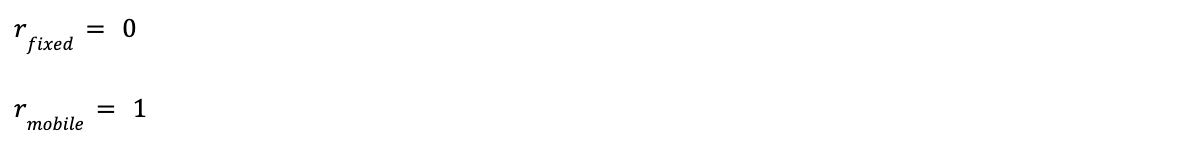
When the delivery network is fixed:

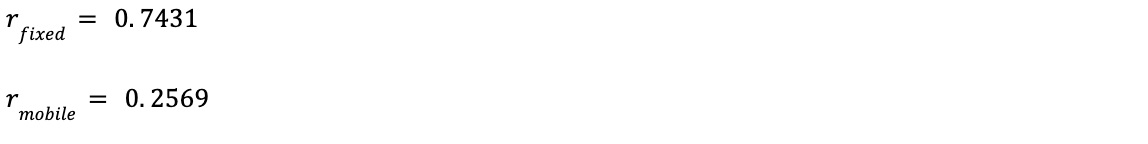
When the delivery country is in the list of European countries:
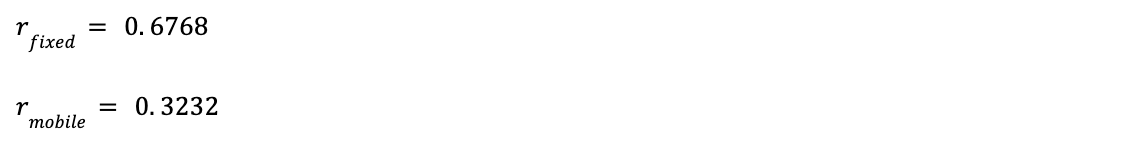
When the delivery country is in the list of APAC countries:
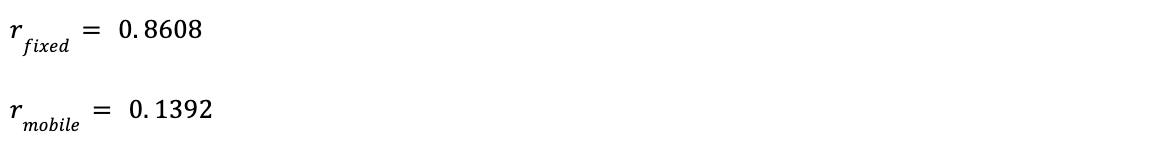
When the delivery country is in the list of North American countries:
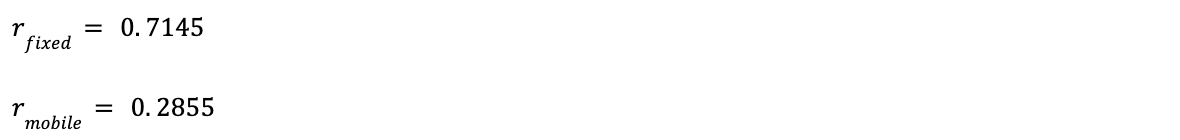
When the delivery country is in the list of LATAM countries:
Consumption Data Guidance
View Time (s)
When the actual ad viewing time is unknown and ads meet the MRC viewability criteria, the following processes can be followed to estimate view time.
When the creative type is ‘Display’ and ‘View Time’ is unknown:

When the creative type is ‘Video’ or ‘Instream Video’ and ‘View Time’ or ‘Duration’ are unknown:

For video ads, when View Time is unknown but creative duration is known:

For video ads, when completion quartiles are known:

Definitions:

When ads are un-viewable, according to MRC criteria, the following processes can be applied:
When the creative type is ‘Display’ and ‘View Time’ is unknown:

When the creative type is ‘Video’ or ‘Instream Video’ and ‘View Time’ is unknown:

Data Points and Emission Factors
Emission factors or energy intensity factors are an important variable in the calculation of GHG emissions in the Digital framework. Emission factors are representative values that attempt to quantify a pollutant, in this case GHG emissions, with an activity associated with that pollutant, i.e. the electricity usage attributable to digital advertising..
Location-based emissions factors, or carbon intensities, refer to CO2e emissions produced per unit of energy consumed, which may vary significantly depending on the geographical region. These factors are influenced by the local energy mix, where regions relying heavily on fossil fuels, such as coal and natural gas, typically exhibit higher carbon intensities compared to those that utilize a greater proportion of renewable energy sources, like wind, solar, and hydroelectric power. For instance, electricity generated in areas with abundant renewable resources will have a lower emissions factor than in regions dependent on coal-fired power plants. Understanding these variations is crucial for businesses and policymakers aiming to accurately measure and reduce their carbon footprints, enabling more targeted and effective strategies for mitigating climate change.
The GHG Protocol, widely used for corporate GHG reporting, also provides guidance on emissions factors in LCA. It recommends using location-based emissions factors that reflect the specific electricity grid where the energy is consumed. The protocol allows for the use of yearly average factors for general reporting, but encourages the use of more granular factors (monthly or hourly) when they are relevant to the analysis.
Currently, we utilise the emissions factors published by EMBER as these are open access, open-source methodology and are currently recommended in the v1.2 of the GMSF.
GMSF v1.2 Key Updates from v1.0
This section contains notes on the changes to each section of GMSF Digital Channel Formulae and guidance from v1.0 to v1.2, highlighting key differences.
Corporate
The corporate emissions overhead is not included in the most recent version of the GMSF. This is due to the current lack of guidance on how these emissions may be attributed. This may be implemented in future sections.
Creation
Post-production Storage
Post-production storage guidance was not present in the previous version of the GMSF. The new guidance in this section accounts for the energy attributed to the storage of creative assets across different storage mediums: hard drives, LTOs and the cloud with both formulae and data guidance being available.
Ad Space Selection
Supply Path (Active Paths)
Previously, the active path model was used to calculate the emissions from the programmatic supply path, however there was no clear guidance for what an active path/supply path actually was.
In the most recent update, the total ‘potentially’ active supply path number relates to the number of lines on an ads.txt. An important note here is that this number is the total “potential” paths, not the actual activated paths, and this number is designed to be conservative in nature. In simple terms, the relationship between ads.txt lines and nodes (Servers) and calls (bid requests/responses) on an active path was modelled using numerical factors (the server factor and call factor) inclusive of the relationship between the impressions, avails requests, bid requests and bid responses. These numerical factors can now be added to the model to extrapolate potentially activated supply paths from ads.txt lines. In the case of no available data, a conservative estimate is provided and may be utilised.
Data Centres
In the previous implementation of the GMSF, data centre emissions calculations were performed using equations and defaults outlined in the SRI methodology. In the most recent version, the calculations are similar, however, some data defaults have changed due to differences in server configurations and updated sources.
Ad Creative Delivery
For delivery, the underlying equations and default data points have changed. There is now only one delivery equation for use-phase and embodied emissions as a server overhead is now applied to the source data.
Consumption
View Time default data remains the same for display vs video, however, the defaults for the proportion of devices have changed. There are also updates to use-phase and embodied emissions from each device.
End-to-End Platforms
Additional guidance has now been provided for end-to-end platforms. One important update is that equations used to estimate emissions from end-to-end platforms, such as social media sites, do not include network calculations for Ad Selection. This is due to the fact that auction servers are contained within the same data centre so no external networking is required and internal networking energy was deemed to be negligible.
Previous Equations and Data Points
In order to provide full transparency to our methodology, all previously used equations and data points utilised in our implementation of GMSF v1.0 can be found in the Appendices section.
Appendix
Appendix 1: GMSF v1.2 Data Points
Data Point | Value | Description | Unit |
Fixed Network Use-Phase Energy | 1.65E-08 | Fixed Network Use-Phase Energy | kWh / KB |
Fixed Network Embodied Emissions | 2.41E-09 | Fixed Network Embodied Emissions | kgCO2e / KB |
Avg Rtb Payload | 3 | Average size of an RTB request | KB |
Yearly Vm Electricity Consumption | 55.2 | Annual Virtual Machine Electricity Consumption | kWh / KB |
Rtb Server Processing Time Per Bid | 100 | RTB Server processing time | milliseconds |
Overhead Factor | 1.25 | Computation Overhead for other not bidding related process | N/A |
Server Pue | 1.56 | Server Performance Unit Effectiveness | N/A |
Local Server Ratio | 0.5 | Ratio of Servers in Local Geography | N/A |
Foreign Server Ratio | 0.5 | Ratio of Servers Abroad | N/A |
Default Ads.txt Lines | 3000 | Default Value for Ads.txt Lines | N/A |
Time Conversion | 3.1558E+10 | Number of milliseconds per year | N/A |
Yearly Server Embodied Emissions | 3.79 | Annual Embodied Emissions of Virtual Machine | Kg CO2e per year |
Display Server Factor | 1.412 | Numerical Factor to derive server number for display formats | N/A |
Video Server Factor | 1.316 | Numerical Factor to derive server number for video formats | N/A |
Average Server Factor | 1.364 | Numerical Factor to derive server number for unknown formats | N/A |
Display Call Factor | 1.464 | Numerical Factor to derive call number for display formats | N/A |
Video Call Factor | 1.334 | Numerical Factor to derive call number for video formats | N/A |
Average Call Factor | 1.399 | Numerical Factor to derive call number for unknown formats | N/A |
Display Creative Weight | 0.25 | Default Display Creative Size | MB |
Direct Sale Server Number | 2 | Number of servers for direct sales | N/A |
Direct Sale Network Request Number | 4 | Number of calls for direct sales | N/A |
Video Creative Weight | 4 | Default Video Creative Size | MB |
Instream Video Creative Weight | 6 | Default Instream Video Creative Size | MB |
Average Creative Weight | 3.417 | Default Unknown Creative Size | MB |
Display Creative Payload | 0.05 | Default Display Payload | MB |
Video Creative Payload | 0.35 | Default Video Payload | MB |
Average Creative Payload | 0.2 | Default Instream Video Payload | MB |
Fixed Network Use-Phase Energy | 0.0000165 | Use-Phase energy attributed to fixed networks | kWh/MB |
Mobile Network Use-Phase Energy | 0.000117 | Use-Phase energy attributed to mobile networks | kWh/MB |
Fixed Network Embodied Emissions | 2.14E-06 | Embodied Emissions attributed to fixed networks | KG CO2e/MB |
Mobile Network Embodied Emissions | 8.70E-06 | Embodied Emissions attributed to mobile networks | KG CO2e/MB |
Cdn Use-Phase Energy | 4.30E-07 | Use-Phase energy attributed to content delivery networks | kWh/MB |
Cdn Embodied Emissions | 5.88E-07 | Embodied Emissions attributed to content delivery networks | kWh/MB |
Display Default View Time | 3 | Default view time for display formats | seconds |
Video Default View Time | 30 | Default view time for video formats | seconds |
Display Unviewable Time | 1 | default view time for unviewable display ads | seconds |
Video Unviewable Time | 2 | default view time for unviewable video ads | seconds |
Average Default View Time | 16.5 | average view time used when format is unknown | seconds |
Q1 Time Multiplier | 0.25 | Video Viewing Quartile Multiplier | N/A |
Q2 Time Multiplier | 0.5 | Video Viewing Quartile Multiplier | N/A |
Q3 Time Multiplier | 0.75 | Video Viewing Quartile Multiplier | N/A |
Q4 Time Multiplier | 1 | Video Viewing Quartile Multiplier | N/A |
North America Fixed Connection Ratio | 0.8608 | Ratio of Fixed Connections in North America | N/A |
North America Mobile Connection Ratio | 0.1392 | Ratio of Mobile Connections in North America | N/A |
Europe Fixed Connection Ratio | 0.7431 | Ratio of Fixed Connections in Europe | N/A |
Europe Mobile Connection Ratio | 0.2569 | Ratio of Mobile Connections in Europe | N/A |
Asia Pacific Fixed Connection Ratio | 0.6768 | Ratio of Fixed Connections in Asia Pacific | N/A |
Asia Pacific Mobile Connection Ratio | 0.3232 | Ratio of Mobile Connections in Asia Pacific | N/A |
Latin America Fixed Connection Ratio | 0.7145 | Ratio of Fixed Connections in Latin America | N/A |
Latin America Mobile Connection Ratio | 0.2855 | Ratio of Mobile Connections in Latin America | N/A |
Mobile Use-Phase Energy | 1.30E-06 | Average Smartphone Use-Phase Energy | kWh/s |
Tablet Use-Phase Energy | 1.40E-06 | Average Tablet Use-Phase Energy | kWh/s |
Pc Use-Phase Energy | 0.0000154 | Average PC Use-Phase Energy | kWh/s |
Tv Use-Phase Energy | 0.000038 | Average TV Use-Phase Energy | kWh/s |
Average Device Use-Phase Energy | 1.0081E-05 | Average Device Use-Phase Energy Based on Device Ratios | kWh/s |
Mobile Embodied Emissions | 6.55E-06 | Average Smartphone Embodied Emissions | KG CO2e /s |
Tablet Embodied Emissions | 0.0000257 | Average Tablet Embodied Emissions | KG CO2e /s |
Pc Embodied Emissions | 5.45E-06 | Average PC Embodied Emissions | KG CO2e /s |
Tv Embodied Emissions | 8.65E-06 | Average TV Embodied Emissions | KG CO2e /s |
Average Device Embodied Emissions | 7.48E-06 | Average Device Embodied Emissions Based on Device Ratios | KG CO2e /s |
Appendix 2: Previously used GMSF v1.0 Conceptual Formulae and Variables:
RTB / Direct Sale Equations
Equation 1 – RTB Server Use-Phase Emissions
= Impressions ∗ Number of potential active paths per impression ∗ Avails ratio ∗ (1 + Requests ratio) ∗ (1 + Responses ratio) ∗ Time of calculation per bid (h) ∗ Compute ratio allocated to bid processing (compute used by SSP/DSP incl. machine-learning) and reporting/analytics (%) * Total relevant infrastructure power incl. PUE (W) * Carbon intensity of electricity ( kgCO2e/kWh) ∗ (1 + overhead of other mutualized server resources ratio )
Variable Definitions
· Impressions = number of impressions
· Number of potential active paths per impression = number of activated paths defined as the connection between a server, SSP and DSP
· Avails ratio = the avail requests ratio sent from a publisher to an SSP
· Request Ratio = the ratio of avails to bid requests
· Response Ratio = the ratio of bid requests to bid responses
· Time of calculation per bid (h) = the time taken for each bid calculation
· Compute Ratio = ratio of physical resources dedicated to bid processing, reporting, machine learning, analytics and other such processes makes up a proportion of total compute power
· Total relevant infrastructure power incl. PUE (W)= the power of each server or other digital infrastructure incorporating the power usage effectiveness (PUE)
· Carbon Intensity (kgCO2e per kWh) = the emission factor based on server/infrastructure location.
· Overhead of other mutualized server resources ratio = additional mutualized infrastructure resources for other services and development activities.
Equation 2: RTB Server Embodied Emissions
Impressions ∗ Number of potential active paths per impression ∗ Avails ratio ∗ (1 + Requests ratio) ∗ (1 + Responses ratio) ∗ Time of calculation per bid (h) ∗ Compute ratio allocated to bid processing (compute used by SSP/DSP incl. machine-learning) and reporting/analytics (%) ∗ EF manufacturing and EOL of total relevant infrastructure (kgCO2e) / Average lifetime of equipment (s) ∗ (1 + overhead of other mutualized server resources ratio)
Variable Definitions
· Impressions = number of impressions
· Number of potential active paths per impression = number of activated paths defined as the connection between a server, SSP and DSP
· Avails ratio = the avail requests ratio sent from a publisher to an SSP
· Request Ratio = the ratio of avails to bid requests
· Response Ratio = the ratio of bid requests to bid responses
· Time of calculation per bid (h) = the time taken for each bid calculation in hours
· Compute Ratio = ratio of physical resources dedicated to bid processing, reporting, machine learning, analytics and other such processes makes up a proportion of total compute power
· EF manufacturing and EOL of total relevant infrastructure (kgCO2e) – the emissions produced from manufacturing and end- of life (EOL) from digital infrastructure.
· Average lifetime of equipment (s) = the average lifetime in seconds of digital infrastructure, for example, the average lifetime of RTB servers.
Equation 3: RTB Network Use-Phase Emissions
= Impressions ∗ Number of potential active paths per impression ∗ Avails ratio ∗ (1 + Requests ratio) ∗ (1 + Responses ratio) ∗ Data transferred by request type (kB) ∗ Server-to-server networks energy efficiency according to network type and country (kWh/kB) ∗ Carbon intensity of electricity ( kgCO2e/kWh)
Variable Definitions
· Impressions = number of impressions
· Number of potential active paths per impression = number of activated paths defined as the connection between a server, SSP and DSP
· Avails ratio = the avail requests ratio sent from a publisher to an SSP
· Request Ratio = the ratio of avails to bid requests
· Response Ratio = the ratio of bid requests to bid responses
· Data transferred by request type (kB) = an estimate may be obtained from bid request or response size + overhead payload of additional assets.
· Server-to-server networks energy efficiency according to network type and country (kWh/kB) = network efficiency depending upon the location of servers.
· Carbon Intensity (kgCO2e per kWh) = the emission factor based on network infrastructure location.
Equation 4: RTB Network Embodied Emissions
= Impressions ∗ Number of potential active paths per impression ∗ Avails ratio ∗ (1 + Requests ratio) ∗ (1 + Responses ratio) ∗ Data transferred by request type (kB) ∗ EF manufacturing & EOL amortization networks according to network type and country (kgCO2e/kB)
Variable Definitions
· Impressions = number of impressions
· Number of potential active paths per impression = number of activated paths defined as the connection between a server, SSP and DSP
· Avails ratio = the avail requests ratio sent from a publisher to an SSP
· Request Ratio = the ratio of avails to bid requests
· Response Ratio = the ratio of bid requests to bid responses
· Data transferred by request type (kB) = an estimate may be obtained from bid request or response size + overhead payload of additional assets.
· EF manufacturing & EOL amortization networks according to network type and country (kgCO2e/kB) = the emissions produced from manufacturing and end- of life (EOL) from digital infrastructure, in this case mobile or fixed networks.
Equation 5: Creative Transmission Server/Edge Node Use-Phase Emissions
= Impressions ∗ total server output data per impression (kB) *
Breakdown of content delivered by ad servers vs. edge nodes (%) ∗ datacentre or edge nodes energy of efficiency including PUE (kWh/kB output) ∗ carbon intensity of electricity (kgCO2e/kWh))
Variable Definitions
· Impressions = number of impressions
· Total server output data per impression (kB) = For static ad formats, a file size proxy + payload overhead of additional assets may be used. For video formats, the portion of file size loaded (incl. buffer) + payload overhead of additional assets should be used.
· Datacentre or edge nodes energy of efficiency including PUE (kWh/kB output)
· Carbon intensity of electricity (kgC02e/kWh)) = the emission factor based on data centre or edge node location.
Equation 6: Creative Transmission Server/CDN Edge Node Embodied Emissions
= Impressions ∗ Total server output data per impression (kB) *
Breakdown of content delivered by ad servers vs. edge nodes (%) ∗ EF manufacturing and EOL of total relevant infrastructure (kgCO2e) / infrastructure output bandwidth (kB/s) / average lifetime infrastructure equipment (s)
Variable Definitions
· Impressions = number of impressions
· total server output data per impression (kB)
· EF manufacturing and EOL of total relevant infrastructure (kgCO2e) = the emissions produced from manufacturing and end- of life (EOL) from digital infrastructure, in this case servers or CDN edge nodes.
· Infrastructure output bandwidth (kB/s) = output bandwidth of servers or edge nodes
· Carbon intensity of electricity (kgC02e/kWh)) = the emission factor based on data centre or edge node location.
Equation 7: Creative Transmission Network Use-Phase Emissions
= Impressions ∗ total data transferred on network per impression (kB)
∗ consumption breakdown between types of networks (%) ∗ energy efficiency according to network type and country (kWh/kB)
* energy efficiency according to network type14 and country (kWh/kB))
* consumption breakdown between countries of servers/edges nodes and & users(%) * carbon intensity of electricity (kgCO2e/kWh))
Variable Definitions
· Impressions = number of impressions
· total data transferred on network per impression (kB) = For static ad formats, a file size proxy + payload overhead of additional assets may be used. For video formats, the portion of file size loaded (incl. buffer) + payload overhead of additional assets should be used.
· Energy efficiency according to network type and country (kWh/kB) = the energy of fixed or mobile networks depending upon network location
· Carbon intensity of electricity (kgC02e/kWh) = the emission factor based on network location.
Equation 8: Creative Transmission Network Embodied Emissions
= Impressions ∗ Total data transferred on network per impression (kB) *
consumption breakdown between types of networks (%)
∗ EF manufacturing & EOL amortization networks according to network type and country (kgCO2e/kB)
Variable Definitions
· Impressions = number of impressions
· Total data transferred on network per impression (kB) = For static ad formats, a file size proxy + payload overhead of additional assets may be used. For video formats, the portion of file size loaded (incl. buffer) + payload overhead of additional assets should be used.
· EF manufacturing & EOL amortisation networks according to network type and country (kgCO2e/kB) = the emissions produced from manufacturing and end- of life (EOL) from digital infrastructure, in this case fixed or mobile networks.
Consumption
Equation 9: User Device Power Use-Phase Emissions
= Device mix by type and country (%) ∗ Time displayed on device (s) ∗ Device render power consumption (W) ∗ time conversion ratio (h/s) ∗ carbon intensity of electricity (kgCO2e/kWh))
Variable Definitions
· Device mix by type and country (%) = for the overall campaign this is the percentage of device an ad was viewed on in each country. For example, 5% of views were on PC in the UK.
· Time displayed on device (s) = the viewing time of the ad.
· Device render power consumption (W) = the power consumption value for each device type.
· Time conversion ratio (h/s) = the conversion factor from hours to seconds.
· Carbon intensity of electricity (kgCO2e/kWh)) = the emission factor based on the user device location.
Equation 10: User Device Power Embodied Emissions
= Device mix by type and country (%) ∗ Time displayed on device (s) ∗ EF manufacturing & and EOL amortization of devices (kgCO2e/unit) / total active used time over lifetime by device type (s of active use over full lifetime)
Variable Definitions
· Device mix by type and country (%) = for the overall campaign this is the percentage of device an ad was viewed on in each country. For example, 5% of views were on PC in the UK.
· Time displayed on device (s) = the viewing time of the ad.
· EF manufacturing & and EOL amortization of devices (kgCO2e/unit) = the emissions produced from manufacturing and end- of life (EOL) from digital user devicesfor example PC or smartphone.
· Total active used time over lifetime by device type (s of active use over full lifetime) = the average active use time of the device over the course total useful life of the device. For example, daily device usage of 2 hours per day over the course of 5 years.
Appendix 3: Previously used GMSF v1.0 Data Defaults
Variable Name | Default Values | Units | Description |
Impressions | N/A | N/A | |
Number of activated paths per impression - Display | 350 | N/A | 350 active paths for Display ads |
Number of activated paths per impression - Video | 100 | N/A | 100 acitive paths for Video ads |
Avails Ratio (Number of Avails) | 1 | N/A | The default number of avails from the user to SSP is 1. |
Requests Ratio (Number of bid requests) | 1 | N/A | The default number of bid requests from the SSP to the publisher is 1. |
Response Ratio (Number of bid responses) | 1 | N/A | The default number of bid responses from the publisher to SSP is 1. |
Time of calculation per bid (h) | 5.56E-06 | hours | |
Compute ratio allocated to bid processing (compute used by SSP/DSP # incl. machine-learning) and analytics (%)) | 50 | % | |
Total Infrastructure power for processing incl. PUE (W) | 14.365 | W | The average power of physical server including the PUE. |
Carbon intensity of electricity (location-based kgCO2e/kWh) - Server Location | Global Carbon Intensity | kgCO2e/kWh | Carbon intensity values are selected based upon geographical location. In the absence of any data, the default value is the average global carbon intensity. |
Overhead of other mutualized server resources ratio (%)) | 50 | % | From SRI database proposed from industry leaders |
EF manufacturing and EOL relevant infrastucture (kgCO2e) - (Server) | 818.4 | kgCO2e | Estimate of server GHG emissions, calculated from Dell LCA. |
Average lifetime of equipment (s) | 157784760 | seconds | Number of seconds in 5 years. Taken from Dell report, most servers (52%) are replaced after 5 years. |
Data Transferred by Request (kb) | 29 | kilobytes | Average size of a http request. |
Server-to-server networks energy efficiency according to network type and country (kWh/kB) | 6.87E-08 | kWh/kB | Average energy efficiency of a fixed network in Use-Phase. |
Carbon intensity of electricity (location-based kgCO2e/kWh) - Network Location | Global Carbon Intensity | kgCO2e/kWh | Carbon intensity values are selected based upon geographical location. In the absence of any data, the default value is the average global carbon intensity. |
EF manufacturing & EOL amortization networks by network type and country (kgCO2e/kB) | Network Emissions Calculation | kgCO2e | Use equation from SRI based upon network traffic for each country and averages. Share of Network traffic is derived from the ITU database. = (share fo fixed network traffic * impact of transporting 1kb of data via fixed network) + (share of mobile network traffic * impact of transporting 1kb of data via mobile network) |
Total server output data per impression (kB) | 307/9000 | kilobytes | 307 kB for Display ads, 9000 kB for Video ads |
Breakdown of content delivered by ad servers vs. edge nodes (%) | 50 | % | Breakdown of content delivered by ad servers vs. edge nodes, business estimate |
Datacenter or edge nodes energy efficiency including PUE (kWh/kB) | 6.87E-08 | kWh/kB | |
Carbon intensity of electricity (location-based kgCO2e/kWh)) - Ad Server/CDN | Global Carbon Intensity | kgCO2e/kWh | Carbon intensity values are selected based upon geographical location. In the absence of any data, the default value is the average global carbon intensity. |
EF manufacturing and EOL server (kgCO2e/unit) - Ad Server / CDN | 818.4 | kgCO2e | Estimate of server GHG emissions, calculated from Dell LCA. |
Server output bandwidth (kB/s) | 125000 | kilobytes/second | From SRI database proposed from industry leaders |
Average lifetime of infrastructure /equipment - Ad Server/CDN (s)) | 157784760 | seconds | Number of seconds in 5 years. Taken from Dell report, most servers (52%) are replaced after 5 years. |
Total data transferred on network per impression (kB) | 307/9000 | kilobytes | We use creative size as the data transfer proxy, from our internal database, the average display creative size is 307kB and the average video creative is 9000kB. |
Consumption breakdown between type of network - mobile vs fixed (%) | Global Average for %Mobile vs %Fixed | % | Country level data from ITU relating to fixed vs mobile network usage from 2022. In the absence of any location data we use a global average breakdown. |
Energy efficiency according to network type and country (kWh/kB) | Network Efficiency Calculation | kWh/kB | Use equation from SRI based upon network traffic for each country and averages energy efficiency per network type. Share of Network traffic is derived from the ITU database = (share fo fixed network traffic * average energy efficiency of a fixed network in Use-Phase) + (share of mobile network traffic * average energy efficiency of a mobile network in Use-Phase) |
Consumption breakdown between countries of servers / edges nodes & users (%) | 100 | % | Estimate |
Carbon intensity of electricity (location-based kgCO2e/kWh)) - Ad Server/CDN Network Transmission | Global Carbon Intensity | kgCO2e/kWh | Carbon intensity values are selected based upon geographical location. In the absence of any data, the default value is the average global carbon intensity. |
EF manufacturing & EOL amortization networks (kgCO2e/kB) | Network Emissions Calculation | kgCO2e/kB | Use equation from SRI based upon network traffic for each country and averages data transfer values per network type = (share fo fixed network traffic * impact of transporting 1kb of data via fixed network) + (share of mobile network traffic * impact of transporting 1kb of data via mobile network) |
Devices Display Time (s) - Display | 3 | seconds | 3s for display per impression |
Devices Display Time (s) - Video | 30 | seconds | 30s for video per impression |
Devices total power consumption - Tablet | 29.4 | watts | Average tablet power in active mode |
Devices total power consumption - PC | 29.4 | watts | Average computer power in active mode |
Devices total power consumption - TV | 81.6 | watts | Average power of a switched-on TV |
Devices total power consumption - Smartphone | 10.4 | watts | Based on the average power of an iphone. (original source macworld but this has been cross-reference with apple documentation. |
Time conversion ratio (h/s) | 0.00028 | N/A | Conversion ratio from seconds to hours |
Carbon intensity of electricity location-based (kgCO2e/kWh) - Viewer | Global Carbon Intensity | kgCO2e/kWh | Carbon intensity values are selected based upon geographical location. In the absence of any data, the default value is the average global carbon intensity. |
EF manufacturing & EOL amortization devices - Smartphone | 84 | kgCO2e | Average impact of a smartphone, including manufacture, transport and end-of-life over its lifespan (excluding use) |
EF manufacturing & EOL amortization devices - Laptop | 175 | kgCO2e | Average impact of a laptop, including manufacture, transport and end-of-life for personal use over its lifespan (excluding use) |
EF manufacturing & EOL amortization devices - Tablet | 75.9 | kgCO2e | Average impact of a tablet, including manufacture, transport and end-of-life over its lifespan (excluding use) |
EF manufacturing & EOL amortization devices - TV | 360 | kgCO2e | Average impact of a television, including manufacture, transport and end-of-life for personal use over its lifespan (excluding use) |
Total active used time over lifetime of Smartphone (s of active use over full lifetime) | 8875575 | seconds | Calculated using SRI database default values |
Total active used time over lifetime of Laptop (s of active use over full lifetime) | 13280490 | seconds | Calculated using SRI database default values |
Total active used time over lifetime of Tablet (s of active use over full lifetime) | 5917050 | seconds | Calculated using SRI database default values |
Total active used time over lifetime of TV (s of active use over full lifetime) | 40498920 | seconds | Calculated using SRI database default values |